Why I built
harPY
I built harPY to investigate why an audio model makes a tuning mistake. A final score cannot tell me whether the input lost information, the pitch estimate was wrong, or the controller made a bad decision. I wanted to change one part and inspect what happened.
harPY means harmonic research in python. Its first task is pitch matching: observe a synthesized tone, adjust octave, semitone, or fine-pitch controls, then submit within five cents of the target. There are seven actions and a 64-action budget.
When would you use harPY?
- Test a general-purpose model. Write an actor that turns the public audio observation into inputs your model accepts and maps its responses to the task’s actions. Measure whether it can finish, how many actions it needs, and where it fails. Record any analysis tools it uses as part of the method.
- Compare representations or estimators. Run matched tones and corruption conditions while keeping control behavior fixed. Check whether better pitch estimates produce more successful submissions.
- Test a control strategy. Compare committing to one estimate with observing again after each adjustment. Inspect the saved actions and inference counts.
You supply the model adapter or actor. harPY supplies the task, baselines, matched episodes, and result files. The Docs show a runnable comparison and how to bring a general-purpose model. That integration is your Python code; a hosted-model connector is not included.
Why begin with a sine wave?
A known source frequency lets me introduce noise, phase, or level changes separately and score the result exactly. It also exposed a failure in the spectrum representation that would have been harder to explain in a recording.
These are tests within a controlled single-tone environment. A general-purpose model’s score here measures its ability to do this task, with the declared observations and tools. Instruments and recorded audio need separate evaluation.
Pitch estimation under noise
Play the source tone, the target note, and each method's final tone. Select Clean to hear the same episode without added noise.
Source: 333.073 Hz.
Target: A3, 220 Hz. Actors receive the target note, not its audio.
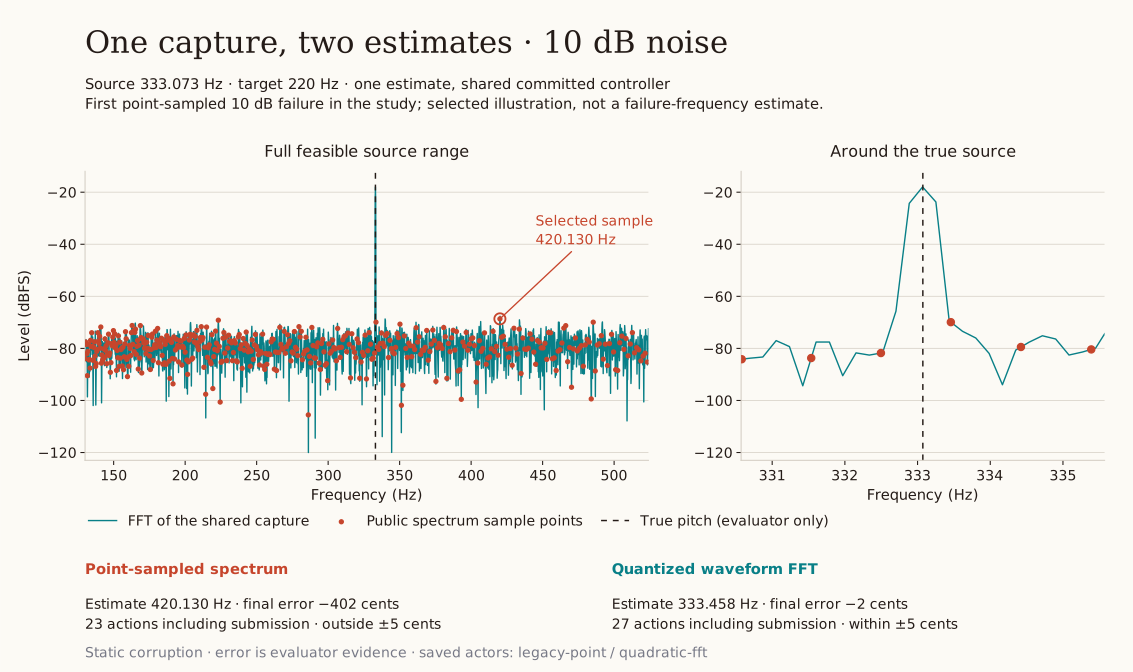
Final pitch error
- Point-sampled spectrum
- −402 cents
- Waveform FFT
- −2 cents
100 cents = one semitone. Negative values mean flat.
View all eight conditions
Listen: source, target, then each final tone. Reconstructed audio.
Listen individually & inspect the saved actions
The A3 reference is for you to hear; actors receive a symbolic target. Audio is reconstructed from recorded states, shortened to two seconds, and faded at each end.
Download audio (WAV)
Clean
Source · Target · Spectrum final · FFT final
Noise (10 dB SNR)
Source · Target · Spectrum final · FFT final
States are derived from the saved actions. One fixed initial estimate per actor; this is not a captured per-step inference trace. Animation speed is illustrative.
Episode: spectrum-preservation-20260908-iid-09-01
Saved actor identities: legacy-point and quadratic-fft.
Replay data · Reconstruction provenance · Full noisy figure
An experiment: a peak between the samples
The player above shows the first point-sampled failure in the saved 10 dB study order. Both methods received the same capture and used the same controller. Clean, both finished two cents flat. With noise, the point-sampled method finished 402 cents flat; waveform FFT still finished two cents flat.
An earlier diagnostic explains the problem. At 429.206 Hz, a narrow FFT peak fell between adjacent samples in the five-cent spectrum grid.
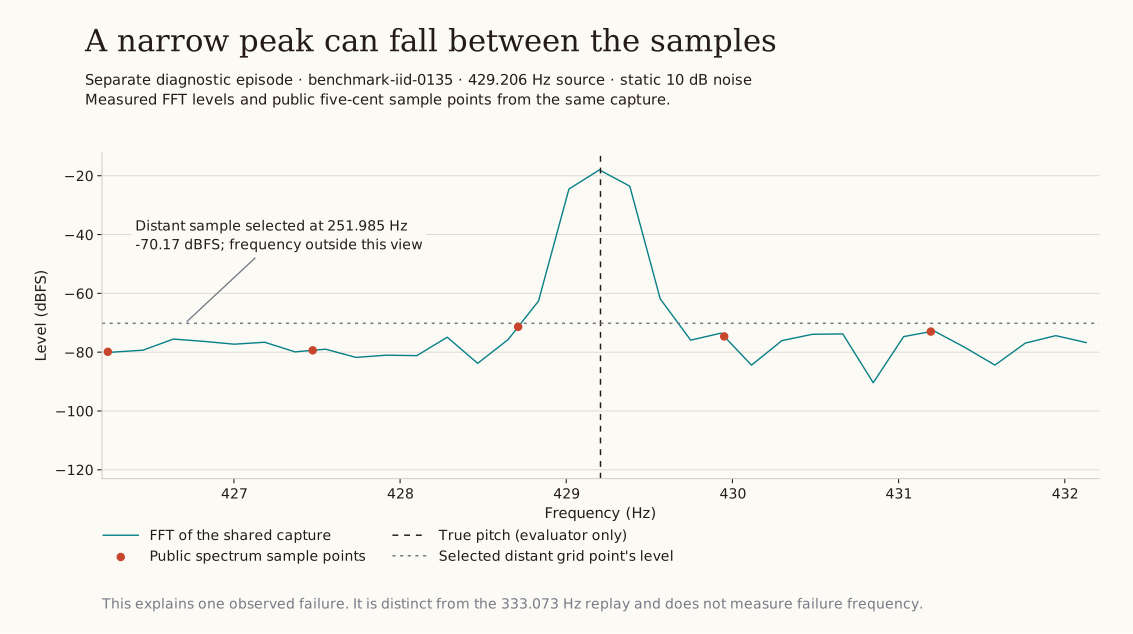
The full FFT located the source within 0.028 cents. The point-sampled spectrum selected a pitch 922 cents below it, and the resulting plan submitted 922 cents sharp. The saved diagnostic records the reconstruction. This is a separate episode from the player.
Hold the controller fixed
I froze 600 source–target pairs and ran three methods under eight conditions. Each used the same waveform capture and five-cent pitch grid, then executed a plan made from one initial estimate.
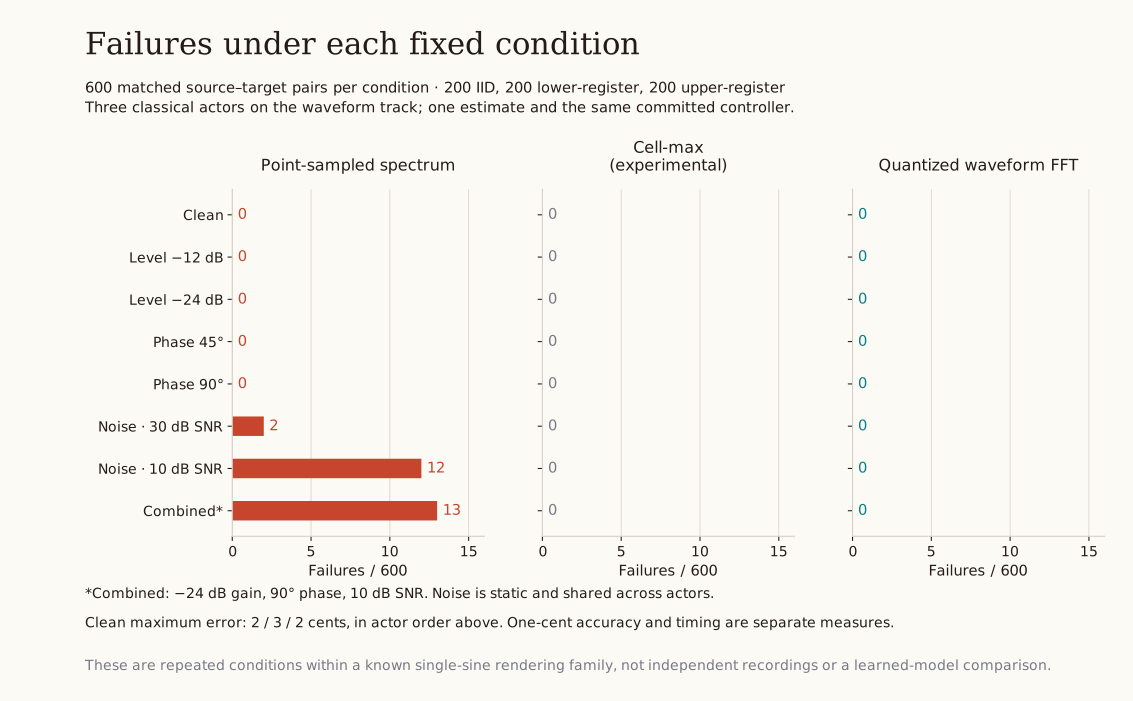
Point-sampled spectrum failed twice at 30 dB SNR, 12 times at 10 dB SNR, and 13 times in the combined condition. Cell-max and waveform FFT recovered those failures without introducing new submission failures in this set.
Full results: successful submissions out of 600
The pairs are split into 200 IID, 200 lower-register, and 200 upper-register episodes.
| Condition | Point-sampled | Cell-max¹ | Waveform FFT |
|---|---|---|---|
| Clean | 600 | 600 | 600 |
| Level −12 dB | 600 | 600 | 600 |
| Level −24 dB | 600 | 600 | 600 |
| Phase 45° | 600 | 600 | 600 |
| Phase 90° | 600 | 600 | 600 |
| Noise, 30 dB SNR | 598 | 600 | 600 |
| Noise, 10 dB SNR | 588 | 600 | 600 |
| Combined² | 587 | 600 | 600 |
¹ Cell-max is an experimental comparison. ² −24 dB gain, 90° phase, 10 dB SNR. Lower SNR means stronger noise relative to the tone.
Each actor made one estimate per episode. There were no invalid actions or budget truncations. Noise stayed fixed within an episode and was shared across actors: static corruption, not live microphone noise.
Cell-max changed 31 clean errors from two cents to three cents. Waveform FFT preserved every clean estimate and action from the original adapter. All three reached one-cent accuracy in 376 of 600 clean episodes; maximum clean errors were two, three, and two cents respectively.
Download plotted data · Figure provenance
Inspect the saved experiment
Download all 14,400 episode records, then run:
gzip -dk spectrum-study.json.gz
harpy summarize spectrum-study.json --format markdown
This is a copy of the original experiment with machine-specific artifact paths made repository-relative. The export manifest records that change and both file hashes. Observations, results, and the original experiment provenance are preserved.
What this changed in harPY
I added waveform-fft as a built-in baseline. It recovered the noisy failures while preserving the clean estimates and plans in this study. Its peak refinement uses quadratic interpolation, described by Julius O. Smith III. The package implementation matched the prototype on all 4,800 initial captures; the integration notes retain that check.
The learned pitch reference was evaluated separately. Seeds 0, 1, and 2 each passed 650 benchmark and 1,000 confirmation episodes on clean audio. Strong-noise failures remain in the qualification report. Those results qualify the saved models on that protocol; they do not establish learned-model superiority.
I want to test whether an encoding that preserves these peaks also helps a learned estimator. That needs a separate experiment.
Run an experiment · Contribute
Research and software references
The spectrum study cites Smith’s interpolation method and discussion of interpolation bias. Optional PPO training uses Proximal Policy Optimization (Schulman et al., 2017) through Stable-Baselines3 (Raffin et al., 2021).